Few executives would disagree that the culture of an organization is a vitally important element of any strategic initiative. Indeed, it can be the main factor that drives success or failure.
And most organizations have some kind of document that describes and celebrates their culture. As a management consultant I’ve seen many of these documents. These cultural tenets may even be carved in stone or displayed prominently throughout the company. I have taken many tours of “company museums” where the culture, milestones and achievements of the organization are proudly on display.
But in spite of these efforts, if you ask most executives how they measure culture, you will get a shrug, or an answer something like the famous one the judge gave about pornography: “I can’t define it, but I know it when I see it.”
I talk to leaders about culture all the time. Nearly every leader will acknowledge the importance of culture. But most will also admit that this is a fuzzy area, difficult to track and measure. You know when it’s working well, and you know when it isn’t. But like a fog or a cloud, when you try to take hold of it, it just ain’t there. Most feel that there is no clear, concrete way to have conversations about culture, no way to grasp it, define clear objectives, or measure it.
What are the KPIs (Key Performance Indicators) for culture? If your culture is truly unique (and it should be!), there can be no “boilerplate” answer to that question.
This is why we developed the Culture Map. It’s a design tool that gives teams a common framework, so they can have better conversations about their organization’s culture, and develop clear and specific action plans and track their progress over time.

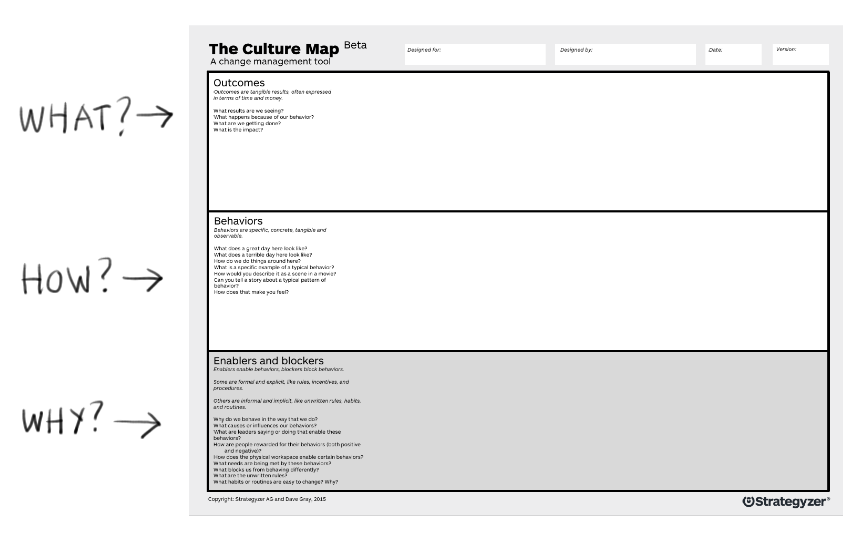
The Culture Map has three components:
Outcomes are the WHATS, the goals the organization is trying to achieve. They may be “hard” goals, things that are easily measured and quantified, like increased sales, greater profitability, faster time to market, higher quality. They may also be “soft” goals, things that are more difficult to measure, like greater teamwork, more collaboration across organizational silos, or simply, as one executive said to me, “I want this to be a fun place to work.”
Behaviors are the HOWS, the things that people do every day to get the work done. This comes down to “how we do things around here.” Behaviors are the habits, routines and rituals of the organization, the way that work gets done. The behaviors are the things people do that are designed to get the outcomes the organization desires.
Enablers and blockers are the WHYS. They are the reasons that people behave the way they do. Enablers and blockers are the examples that leaders set by their own behaviors, the systems and structures they create, the kinds of behaviors that are rewarded and celebrates as well as those that are punished. Enablers and blockers are usually a complex combination of written procedures and unwritten rules, and although they are rarely on the table for discussion, this is the stuff that drives culture.
Outcomes and behaviors (The WHATS and the HOWS) are “above the water line.” Conversations about culture usually revolve around these topics, and rarely dip beneath the surface to deal with the underlying enablers and blockers. Culture Mapping, described in detail elsewhere, is an approach designed to take a deep dive and connect those “underwater” issues (The WHYS) with behavior and outcomes, so people can start to see their culture as a system which can be clarified, defined, understood and measured.
Since enablers and blockers are the main drivers of culture, they are the areas that management needs to focus on to enable cultural change. But there are dozens, if not hundreds, of enablers and blockers in any organization. Where to begin?
The Culture Mapping tool and approach is designed to help you narrow in on those three to five specific enablers and blockers that will have the most impact at any given time.
These enablers and blockers will be different in every organization, so let me give you an example.
One organization we worked with was trying to drive more creativity and collaboration across the various divisions and functions of the company. Using the Culture Map, we identified one management attitude that was blocking collaborative behavior. Employees felt that they were expected to be at their desk at all times. In conversations with employees we heard the following kinds of statements:
“I’m expected to be at my desk at all times. If I’m not at my desk, in my manager’s eyes, that means I am not working.”
“In a typical day I find myself sitting at my desk exchanging 15 emails with someone who sits just a short walk down the hall. I could resolve this by walking over there and having a short conversation, but instead, I sit there and we play email ping-pong.”
“Appearing busy is more important than getting work done.”
“There’s a company policy that says we can work from home, but the informal pressure from my boss says the opposite.”
We summarized this blocker as “wandering is not working.” To measure this blocker, we created a survey question which was used to measure progress.
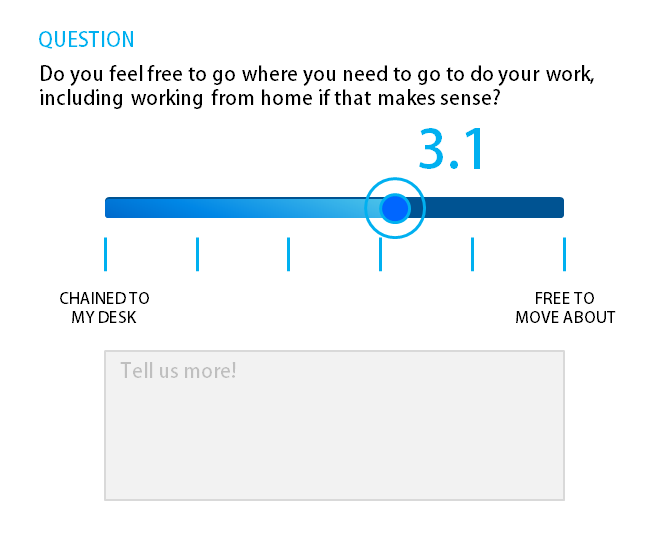
When it comes to enablers and blockers, perception is reality. If people perceive them to be there, they influence behavior. Over time, questions such as this give leaders a way to track and measure progress, and answer the question “How are we doing?”
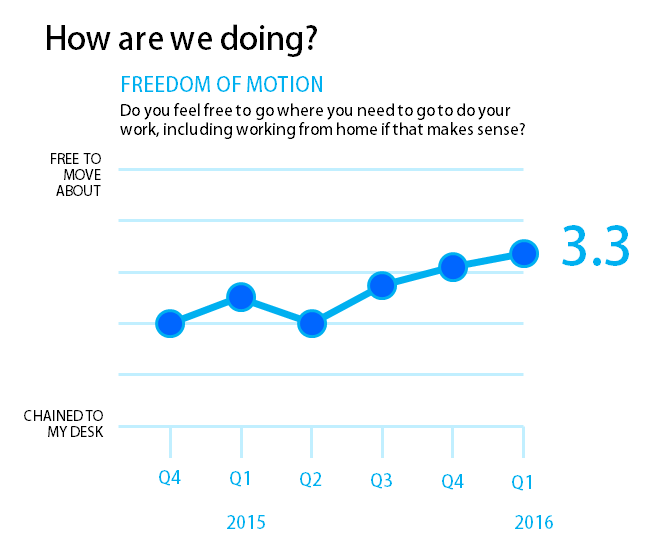
Enablers and blockers are the fundamental units of culture change. When progress on has been made on one enabler or blocker, and the measure seems sufficient, the questions can be changed to measure progress on other enablers and blockers. This takes time.
Changing culture is hard. We don’t recommend focusing on more than one enabler or blocker at any one time. But over time, your organization can develop clear and meaningful culture metrics and create the culture you want, one step at a time.